



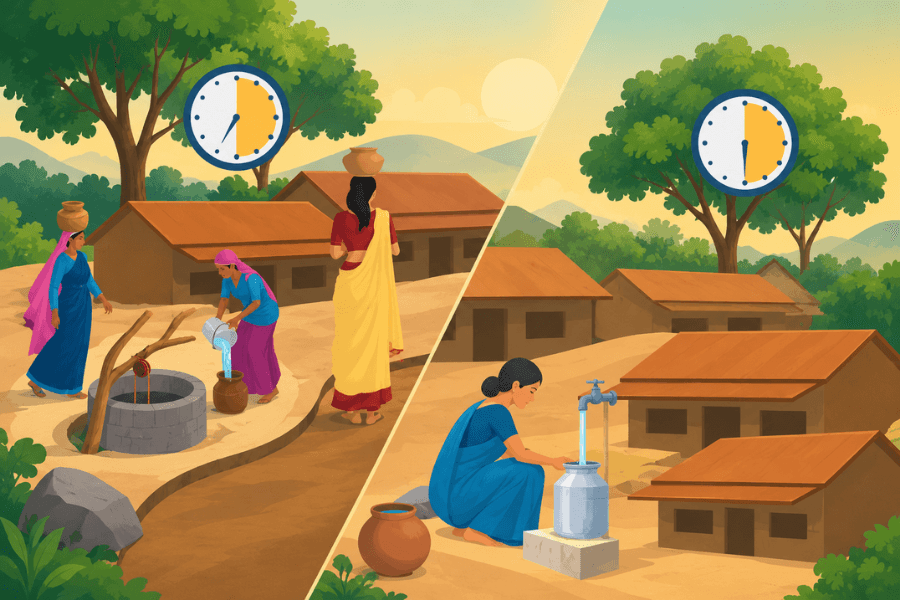
For decades, progress in rural water supply in India was often measured by the assets created: handpumps installed, schemes sanctioned and habitations declared covered. The Jal Jeevan Mission (JJM), launched in August 2019, brought attention to something a household can directly recognise: a tap inside its premises. By the end of 2024, mean tap-water coverage across districts had increased by approximately 60 percentage points. Nationally, reported rural household coverage had risen from about 17 percent at launch to nearly 80 percent.
The more consequential question is what this expansion has meant for the time households spend obtaining water. Water is unusual among public goods because inadequate access is paid for in hours as well as rupees. Someone walks, waits, carries water home and repeats the task when needed. That person is disproportionately a woman. If improved access is delivering a welfare gain, one place to look for it is in the time released from collecting water. The 2019 and 2024 Time Use Surveys, read alongside district-level JJM coverage, offer evidence on how rural women’s water-collection time changed during this expansion.
The Time Behind the Headcount
Among rural women aged 15 to 59, the share reporting water collection was 12.8 percent in 2019 and 12.9 percent in 2024. For rural adults as a whole, the share rose slightly, from 7.9 to 8.6 percent. Roughly one in eight rural working-age women therefore still reported collecting water in 2024.
That does not mean the burden stayed the same. A count of women collecting water cannot distinguish between a twenty-minute task and a ninety-minute one. For that, we need to look at how long collection takes.
Fewer Long Collection Days
Among rural women who collected water, average time spent on the task fell from about 49 minutes a day in 2019 to 42 minutes in 2024. Across all rural women, including those who did not collect water, the average fell marginally from 6.2 to 5.4 minutes a day, i.e., a decline of 0.8 minutes per woman.
Long collection days also became less common. Among women who collected water, the share spending 60 to 89 minutes a day fell from about 35 to 26 percent, while the share spending 90 minutes or more fell from 11 to 7 percent. Because lengthy collection days affected very few individuals and most women reported no collection on the survey day, the prevalence of these lengthy collection days and its subsequent decline are easily obscured in population-wide averages.
These surveys do not follow the same women over time. They show that lengthy collection days became less common, but cannot tell us which individuals saved time.
Time Saved Does Not Automatically Become Paid Work
Over the same period, rural women’s average time spent on unpaid domestic work fell by around six minutes a day. Time spent on caregiving rose by about nine minutes, while employment increased by roughly five. For rural adults as a whole, employment time rose by around 24 minutes and domestic work fell by about 20 minutes.
These population averages cannot tell us where a particular woman’s saved water-collection time went. But the changes sit alongside a persistent constraint: making water easier to obtain does not, by itself, redistribute care responsibilities or create paid work. Evidence from Benin, Madagascar and Morocco similarly shows that easing household time constraints does not necessarily increase women’s participation in paid employment. Time savings matter, but the opportunities to absorb them also matter as much.
The Gap Between Coverage and Time
The district-level comparison produces a more surprising result. Districts with larger increases in reported tap-water coverage do not generally show larger declines in women’s water-collection time. The relationship is weak whether we look at the share of women collecting water or at minutes spent among those who do. A district that added 90 percentage points of coverage looks much like one that added 20 percentage points. If anything, districts with larger coverage gains show slightly smaller declines in minutes per collector.
This does not mean new connections saved no time. A comparison across districts cannot isolate the effect of JJM from other changes between 2019 and 2024. But the scale of a district’s reported coverage gain, by itself, tells us little about how its water-collection burden changed.
Does a reported connection provide water reliably enough to replace the old source? Where supply is intermittent, households may keep collecting water even after a tap is installed. The connection is recorded, the pipe exists, but the walk continues. The time-use evidence cannot establish whether unreliable supply explains the district pattern. It shows why the question matters.
The Next Measure of Progress
The next challenge is sustained service delivery. JJM already uses independent assessments to examine whether household tap connections function. Building on that work, supply hours, pressure, unplanned outages and water quality should be measured regularly, with locally useful results made public. Repeated independent assessments could help identify where reported coverage and actual service diverge.
Time-use measures belong alongside those service measures. Coverage tells us how far infrastructure has reached; time spent obtaining water tells us something about what it has changed. India’s expansion of rural tap connections is a substantial achievement. The next measure of progress is whether households can rely on those taps and whether women still have to make the walk.